Here are some numbers that put into perspective the human dominance of the planet: people and domesticated livestock account for 96 percent of the biomass of all mammals on the planet. In other words, if you weighed up all the mammals of the planet on a giant scale, wild mammals (including those very heavy whales and elephants) are only 4 percent of the total. Yikes! The same holds true for birds. The biomass of all the chicken in the world is about three times higher than that of wild birds. What if conservation measures that put their goals in terms of land area (like Madagascar’s Durban Vision of 10% in protected areas, or E. O. Wilson’s Half-Earth) switched to a biomass goal instead?
These numbers come from Bar On et al.’s (2018) paper in the journal PNAS entitled The biomass distribution on earth. They use gigatons of carbon as their measure, as this is independent of water content.
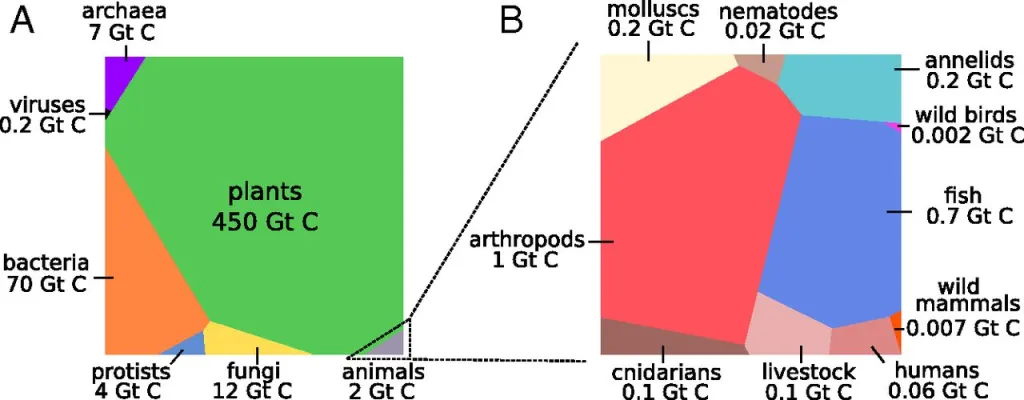
Here’s the original paragraph from that paper (references removed): “Over the relatively short span of human history, major innovations, such as the domestication of livestock, adoption of an agricultural lifestyle, and the Industrial Revolution, have increased the human population dramatically and have had radical ecological effects. Today, the biomass of humans (≈0.06 Gt) and the biomass of livestock (≈0.1 Gt) far surpass that of wild mammals, which has a mass of ≈0.007 Gt. This is also true for wild and domesticated birds, for which the biomass of domesticated poultry (≈0.005 Gt C, dominated by chickens) is about threefold higher than that of wild birds (≈0.002 Gt). In fact, humans and livestock outweigh all vertebrates combined, with the exception of fish. Even though humans and livestock dominate mammalian biomass, they are a small fraction of the ≈2 Gt C of animal biomass, which primarily comprises arthropods (≈1 Gt), followed by fish (≈0.7 Gt). Comparison of current global biomass with prehuman values … demonstrates the impact of humans on the biosphere. Human activity contributed to the Quaternary Megafauna Extinction … which claimed around half of the large land mammal species. The biomass of wild land mammals before this period of extinction was estimated by Barnosky at ≈0.02 Gt. The present-day biomass of wild land mammals is approximately sevenfold lower, at ≈0.003 Gt. Intense whaling and exploitation of other marine mammals have resulted in an approximately fivefold decrease in marine mammal global biomass [from ≈0.02 Gt to ≈0.004 Gt]. While the total biomass of wild mammals (both marine and terrestrial) decreased by a factor of ≈6, the total mass of mammals increased approximately fourfold from ≈0.04 Gt to ≈0.17 Gt due to the vast increase of the biomass of humanity and its associated livestock. Human activity has also impacted global vertebrate stocks, with a decrease of ≈0.1 Gt in total fish biomass, an amount similar to the remaining total biomass in fisheries and to the gain in the total mammalian biomass due to livestock husbandry….“


Vaclav Smil, in the Earth’s biosphere, made this calculation some years ago. The illustration from xkcd (https://xkcd.com/1338/) is more explicit than this kaleidoscope. 🙂
Vaclav Smil, in the Earth’s biosphere, made this calculation some years ago. The illustration from xkcd (https://xkcd.com/1338/) is more explicit than this kaleidoscope. 🙂